When I teach R, I always caution the audiences about the quirks of R programming. It is very typical for someone with a background in Java or Python to write code in R that will take forever to execute (like I used to do, and sometimes still do). I warn the students about loops and... Continue Reading →
Surviving and Thriving in Online Labor Markets
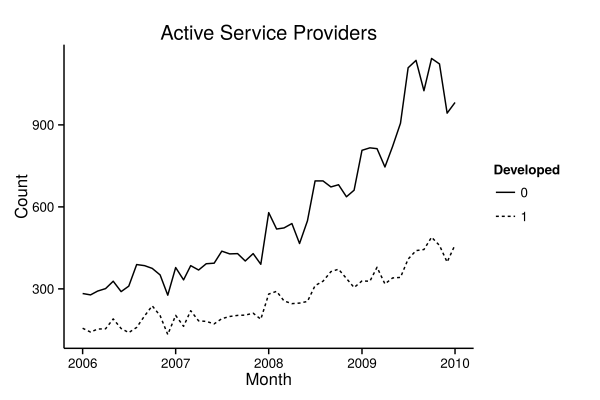
I will be presenting our paper, "Surviving and Thriving in Online Labor Markets" this weekend at WISE 2015. Our study aims to uncover the dynamics shaping the online labor markets (freelancer.com, upwork.com, elance.com ...), with a focus on the role of country development level on the IT service providers' ability to survive and earn a... Continue Reading →
Google TensorFlow

Google open sourced TensorFlow (TF), a distributed machine learning library, in November. The basic idea is that, you build your ML process into a graph and let TF handle the running and distribution of the work between cores. Be it cores in your CPU or GPU, TF has you covered. The dataflow graph works much... Continue Reading →
IBM Watson Explorer, Predictive Analytics Made Easy?

I am currently developing a tutorial for EMBA students for IBM's Watson Explorer. Having just recently finished content development for R workshop for MSBA, I must say it is a pretty interesting experience. On the one hand you have R, a complex but powerful tool that is designed to lift (almost) any kind of analytics... Continue Reading →
R Workshop Documentation (Updated)
")
I have been working on the upcoming R workshop for a few weeks now. Finally I am ready to publish part of the material in the spirit of open source, so that others can benefit from, and improve upon my material. I uploaded all the materials to my github repository. There are a few documents... Continue Reading →
Integrating R Code in Beamer Presentations

I am preparing presentations for the upcoming R workshop. That means I have to find a way to integrate R code and results into my presentations. Now I know there are a number of ways to achieve this, but I like beamer for presentations and R for analysis. Now thanks to Knitr, I can bring... Continue Reading →
World Map Visualizations Based on Data in R

I am working on a workshop for Business Analytics masters students. Part of the demos I intend to use are geographical visualizations. I am using rworldmap package to achieve these. Let us say you have geographical data in a data.frame such as country, with country identifiers stored in "ip_iso2" column in ISO2 format and the... Continue Reading →
Beamer use Tikz to Highlight Certain Parts of Tables

EDIT: I CHANGED THE SERVICE PROVIDER FOR THE BLOG AND THE CODE BLOCK BELOW GOT MESSED UP. ALL SLASHES ARE GONE. BEWARE I did my proposal yesterday and it went well 😀 I used beamer to prepare my slide deck and was very pleased with how easy it was to work with. R already has... Continue Reading →
AWS Educate For Teaching and Research
I was pleasantly surprised to find out that Arizona State University was a member of AWS educate, more so since my year of free trial ran out last month and I just payed my first bill for the Amazon instance I use for data collection. Amazon Web Services provides an easy to deploy, easy to... Continue Reading →
