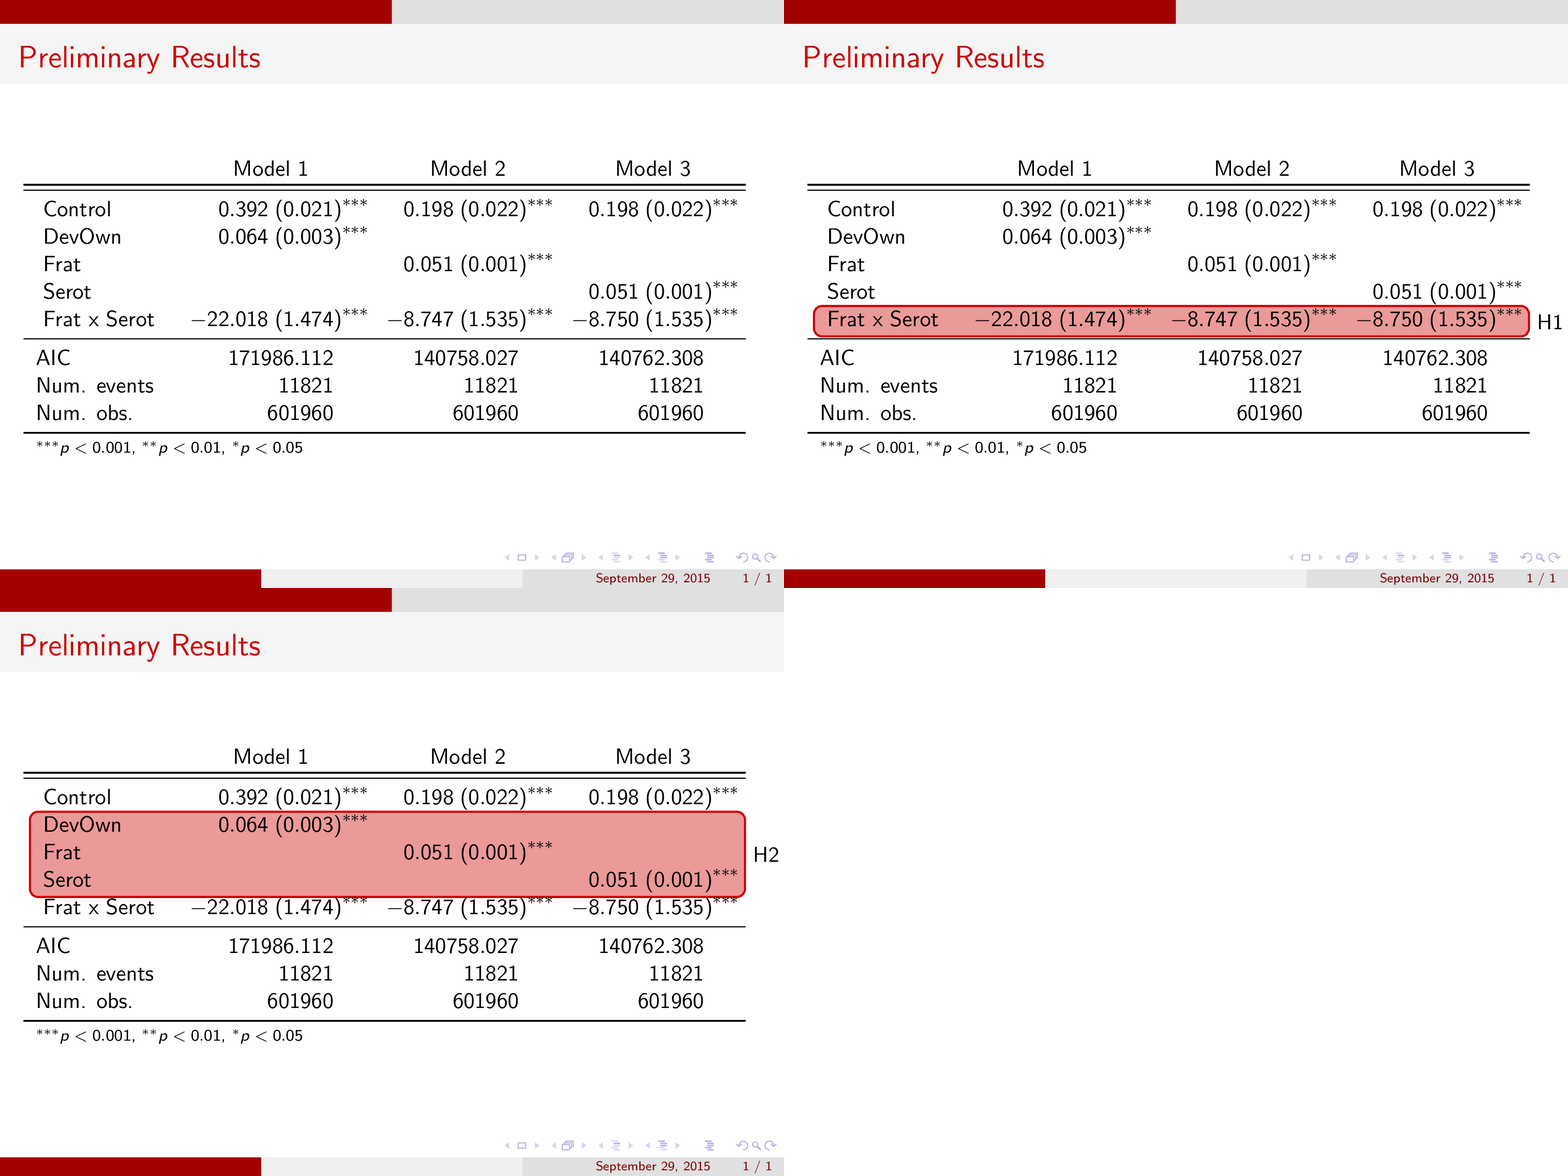

Beamer use Tikz to Highlight Certain Parts of Tables
EDIT: I CHANGED THE SERVICE PROVIDER FOR THE BLOG AND THE CODE BLOCK BELOW GOT MESSED UP. ALL SLASHES WERE GONE. I TRIED TO FIX IT MANUALLY. BEWARE
I did my proposal yesterday and it went well 😀
I used beamer to prepare my slide deck and was very pleased with how easy it was to work with. R already has functionality to export tables to Latex format and they looked gorgeous in beamer.
I wanted to highlight certain parts of the results table and discuss the results as they relate to hypothesis. I achieved this through tikzmarkin and tikspicture. Below is an example and above is how it looks.
\documentclass{beamer}

% for themes, etc.

mode<presentation>

\usetheme{CambridgeUS}

\usecolortheme{beaver}

\usepackage{times} % fonts are up to you

\usepackage{graphicx}

% The usual suspects

\usepackage{multirow, booktabs, dcolumn, color} % Tables

% The table highlighting for hypothesis discussion.

\usepackage[beamer,customcolors]{hf-tikz}

\usetikzlibrary{calc}

% To set the hypothesis highlighting boxes red.

\tikzset{hl/.style={

   set fill color=red!80!black!40,

   set border color=red!80!black,

   },

}

\begin{document}

\begin{frame}

\frametitle{Preliminary Results}

\resizebox{.99linewidth}{!}{

\begin{tabular}{l D{)}{)}{14)3}@{} D{)}{)}{13)3}@{} D{)}{)}{13)3}@{} }

& \multicolumn{1}{c}{Model 1} & \multicolumn{1}{c}{Model 2} & \multicolumn{1}{c}{Model 3}

\toprule

\midrule

~Control           & 0.392 ; (0.021)^{}   & 0.198 ; (0.022)^{}  & 0.198 ; (0.022)^{}
\tikzmarkin<3>[hl]{bH2}DevOwn           & 0.064 ; (0.003)^{}   &                         &

~Frat            &                          & 0.051 ; (0.001)^{}  &
~Serot           &                          &                         & 0.051 ; (0.001)^{}  \tikzmarkend{bH2}

\tikzmarkin<2>[hl]{bH1}Frat x Serot     & -22.018 ; (1.474)^{} & -8.747 ; (1.535)^{} & -8.750 ; (1.535)^{***} \tikzmarkend{bH1}

\midrule

AIC              & 171986.112               & 140758.027              & 140762.308

Num. events      & 11821                    & 11821                   & 11821

Num. obs.        & 601960                   & 601960                  & 601960

\bottomrule

\multicolumn{4}{l}{scriptsize{$^{}p<0.001$, $^{}p<0.01$, $^p<0.05$}}

\end{tabular}

}

\only<2>{

% Place the hypothesis number next to the highlighted area

\begin{tikzpicture}[remember picture,overlay]

\node[align=left, left] at ({pic cs:bH2}) {small{H2}};

\end{tikzpicture}

}

\end{frame}

\end{document}